Sprucely
Freemium
Automates data insights pipeline, creating interactive decision intelligence dashboards.
Key Information
Key Information
Features
- Automated data pipeline processing
- Interactive dashboard creation
- Multi-dimensional charting capabilities
- Hybrid cloud deployment options
- AI-powered insights generation
- Export flexibility across platforms
- Cross-platform compatibility
- Real-time data processing
- Built-in dashboard editor
- Data sanitation tools
Pros
- Rapid dashboard deployment
- No viewer limitations
- Flexible hosting options
- Simple pricing structure
Cons
- Storage restrictions on lower tiers
- Row limitations in free plan
- Limited AI credits
Pricing
- Free plan at $0/month
- Regular plan at $8/month
- Premium plan at $28/month
- Enterprise plan at $89/month
—
What is Sprucely?
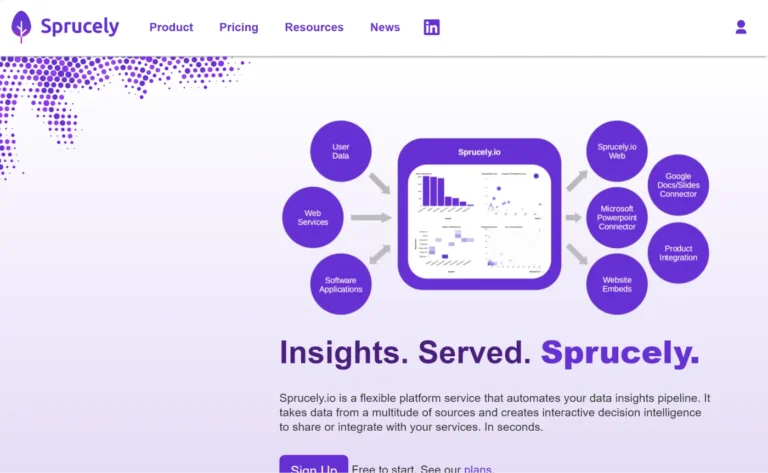
Sprucely is a data insights platform that transforms raw data into interactive dashboards and visual reports. The platform automates the entire process from data ingestion to visualization, allowing users to create and share interactive decision intelligence through web browsers or embedded in documents and presentations.
Key Features
- Automated data pipeline processes information from multiple sources including files, web streams, and databases to generate instant insights
- Interactive dashboard creation with customizable layouts, themes, and branding options for professional visualization
- Multi-dimensional charting supports 1D, 2D, and 3D chart gadgets along with text and image elements
- Hybrid cloud deployment enables both cloud and on-premise hosting with secure data management
- AI-powered insights provide direct text queries to dashboard rendering capabilities
- Export flexibility allows sharing through web embeds, documents, presentations and native printing
- Cross-platform compatibility works across web browsers and integrates with Microsoft Office tools
- Real-time data processing handles live data streams and automatic updates
- Built-in dashboard editor for quick customization of layouts and themes
- Data sanitation tools ensure clean and properly formatted information
Main Advantages
- Rapid deployment takes only seconds to create interactive dashboards
- No viewer limitations allows unlimited sharing of dashboards
- Flexible hosting options with both cloud and on-premise solutions
- Simple pricing structure with fixed monthly fees and no hidden costs
Key Limitations
- Storage restrictions on lower-tier plans limit data capacity
- Row limitations in free plan constrain dataset size
- Limited AI credits in lower-tier subscriptions
How much does Sprucely cost?
Free – $0/month
- Corporate or personal user access
- 1MB storage space
- Basic rendering features
- Limited dataset rows
Regular – $8/month
- 100MB storage
- Unlimited rows and datasets
- Enhanced rendering features
Premium – $28/month
- 1GB storage
- 50,000 AI credits
- REST API access
Enterprise – $89/month
- 10GB storage
- 200,000 AI credits
- Full enterprise features
Frequently Asked Questions
1. Who is using Sprucely?
- Business analysts creating interactive reports and presentations
- Data scientists needing quick visualization of complex datasets
- Corporate teams sharing real-time business intelligence
- Marketing professionals building interactive client presentations
- Software developers embedding data visualizations in applications
- Research organizations analyzing and presenting study results
2. How does Sprucely compare to other visualization tools?
Sprucely stands out from traditional visualization tools by offering automated data processing and instant dashboard creation. While tools like Tableau focus on complex analysis, Sprucely prioritizes speed and simplicity in creating shareable visualizations.
3. What file formats does Sprucely support?
Sprucely accepts various file formats including JSON, Microsoft Excel (.xls/.xlsx), OpenDocument sheets (.ods), Parquet databases, and text files (.txt/.csv). The platform can also process data directly from web streams.
4. Can I customize the appearance of my dashboards?
Yes. The platform includes 48 theme styles and a built-in dashboard editor. Users can customize layouts, colors, and branding elements to match their organization’s design requirements.
5. What happens to my data when I share dashboards?
When sharing dashboards, data remains secure within your selected environment. For on-premise deployments, the Sprucely connector ensures data flows exclusively between your browser and local storage, keeping sensitive information within your network.
6. How does the AI credit system work?
AI credits power the platform’s text-to-dashboard features. Free users receive trial credits, while paid plans include monthly allocations ranging from 10,000 to 200,000 credits. These credits enable natural language processing for creating and modifying dashboards through text commands.
Promote Sprucely
Featured Badge for this tool:
Free Trial
Comprehensive transcription and analysis platform for audio, video, and text.
Freemium
AI-powered text editing with real-time proofreading, style suggestions, and change tracking.
Free Trial
Cloud integration platform for connecting applications and data systems.
Freemium
GitHub project analyzer for candidate skill assessment.
Freemium
LangChain is a framework for building applications that integrate language models with external data sources, enabling complex interactions and context-aware responses.
Freemium
Flexible workspace management and collaboration platform.